
Your marketing attribution dashboard, at a glance
Overview is your marketing attribution dashboard: what happened this month in one plain sentence, then the figures behind it, revenue, where it came from, and what changed. Everything else in Trace is one click from here.
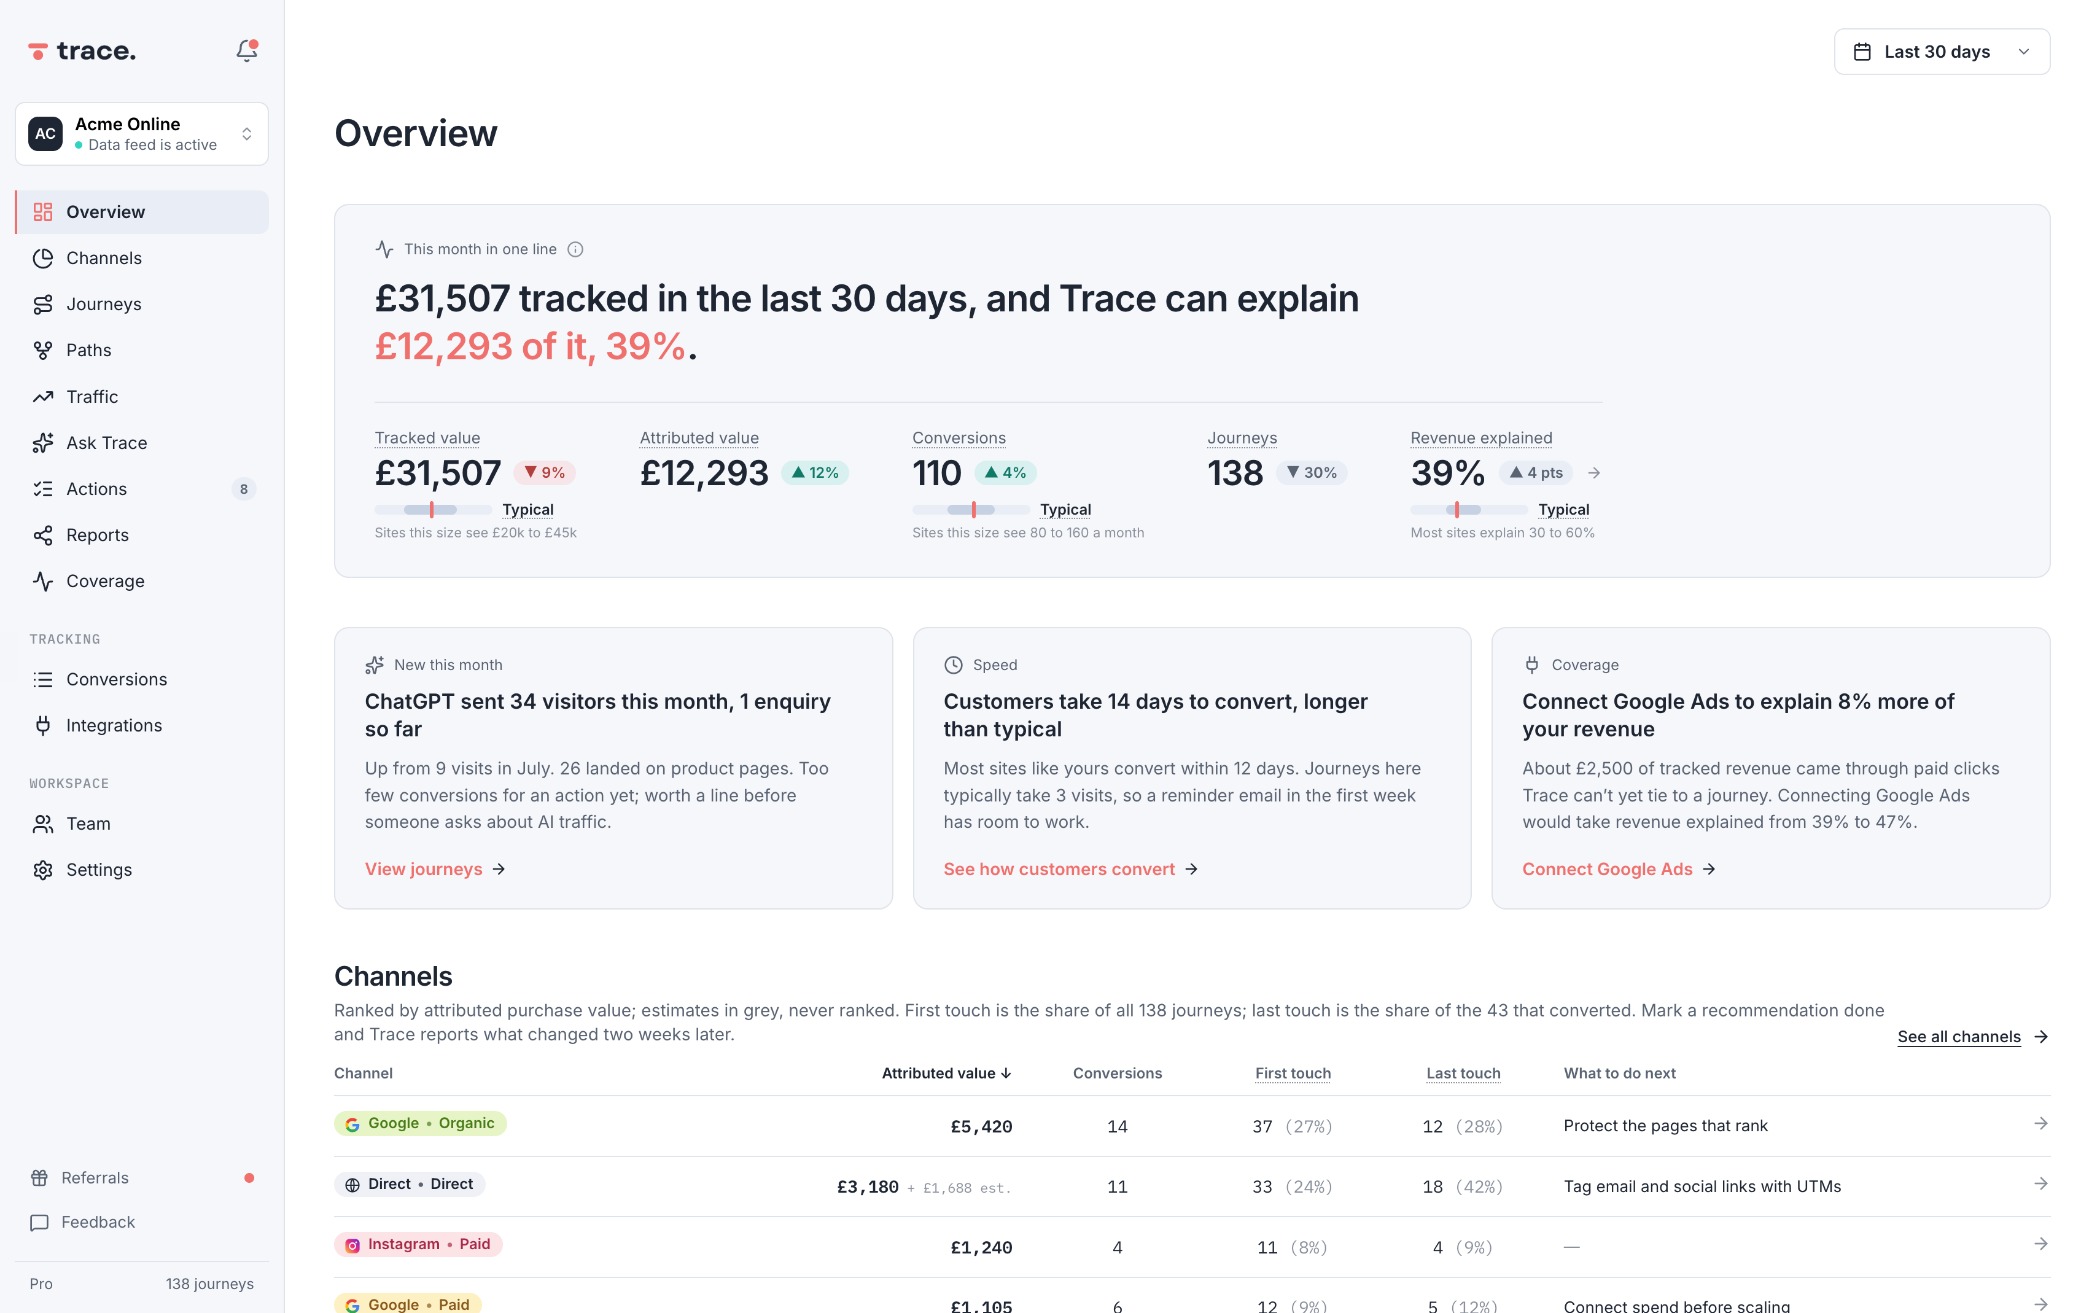
One sentence first
What happened this month and why, in plain English, before any chart.
Three things that changed
Each channel stated as a fact with the journeys behind it one click away.
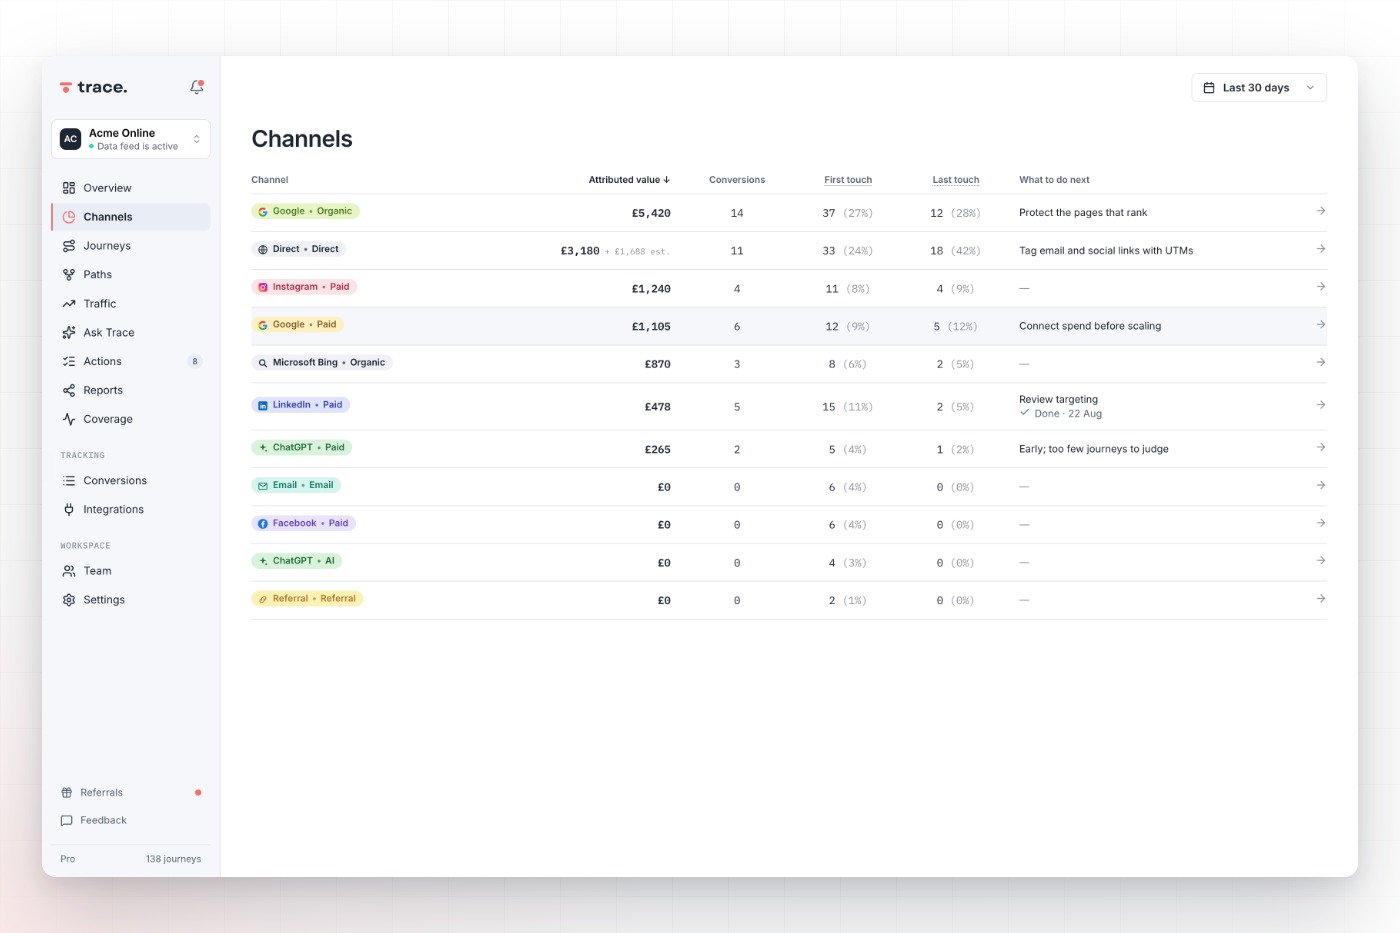
The channel table
Channels ranked by attributed revenue, with what each platform claimed beside it.
Where did the budget go?
For any month, what each platform claimed next to the sales and leads you actually counted. Export it for the next budget meeting.
The sentence, then the figures
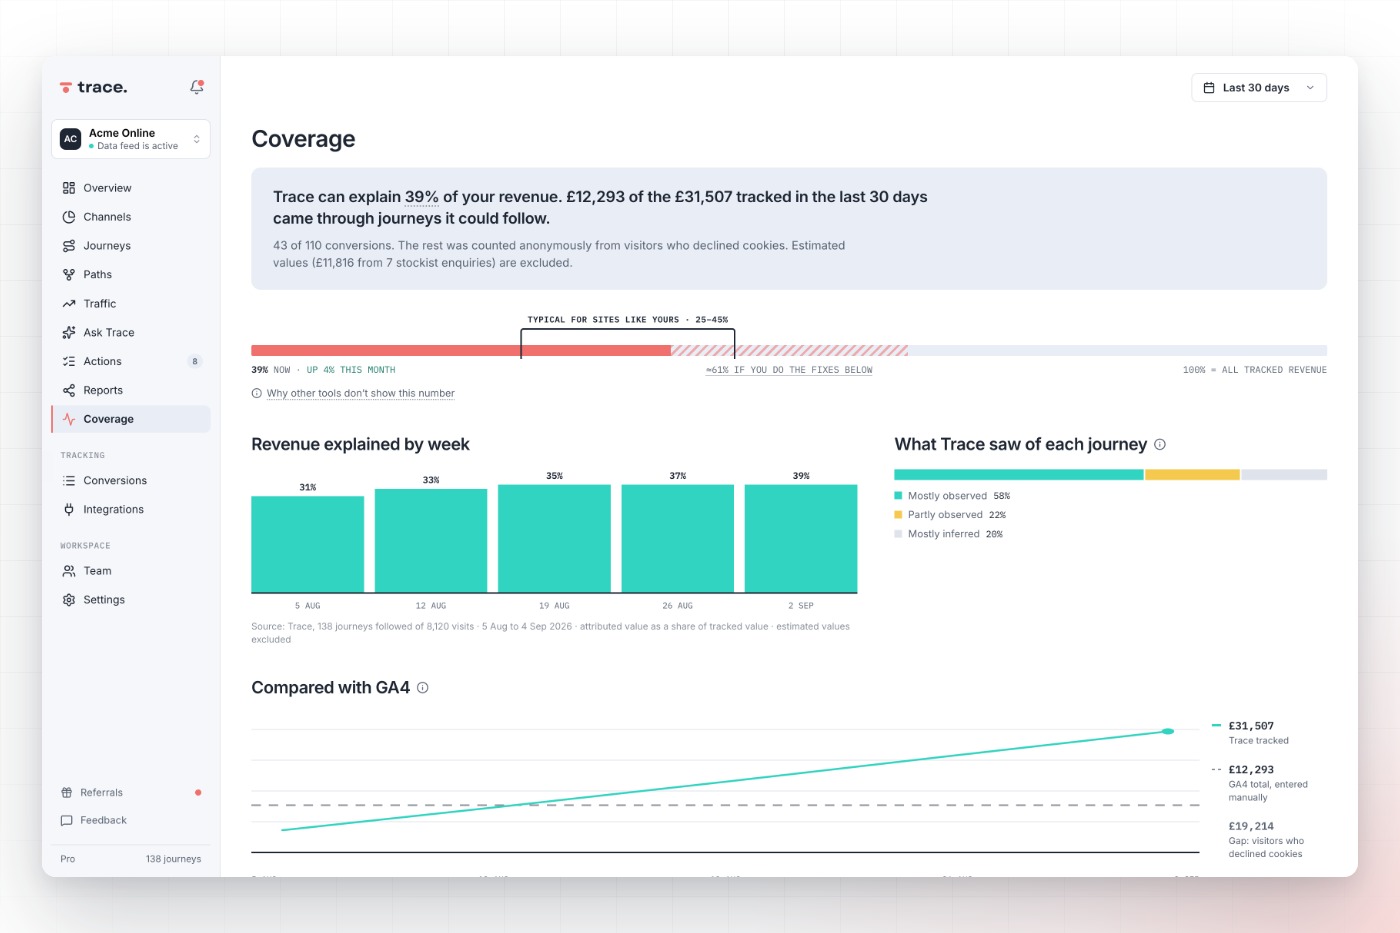
Overview opens with one line on what happened this month and why. Under it sit the counted figures: revenue, sales and leads, with your Coverage beside them so you know how much of the picture they cover.

Three things worth knowing this week
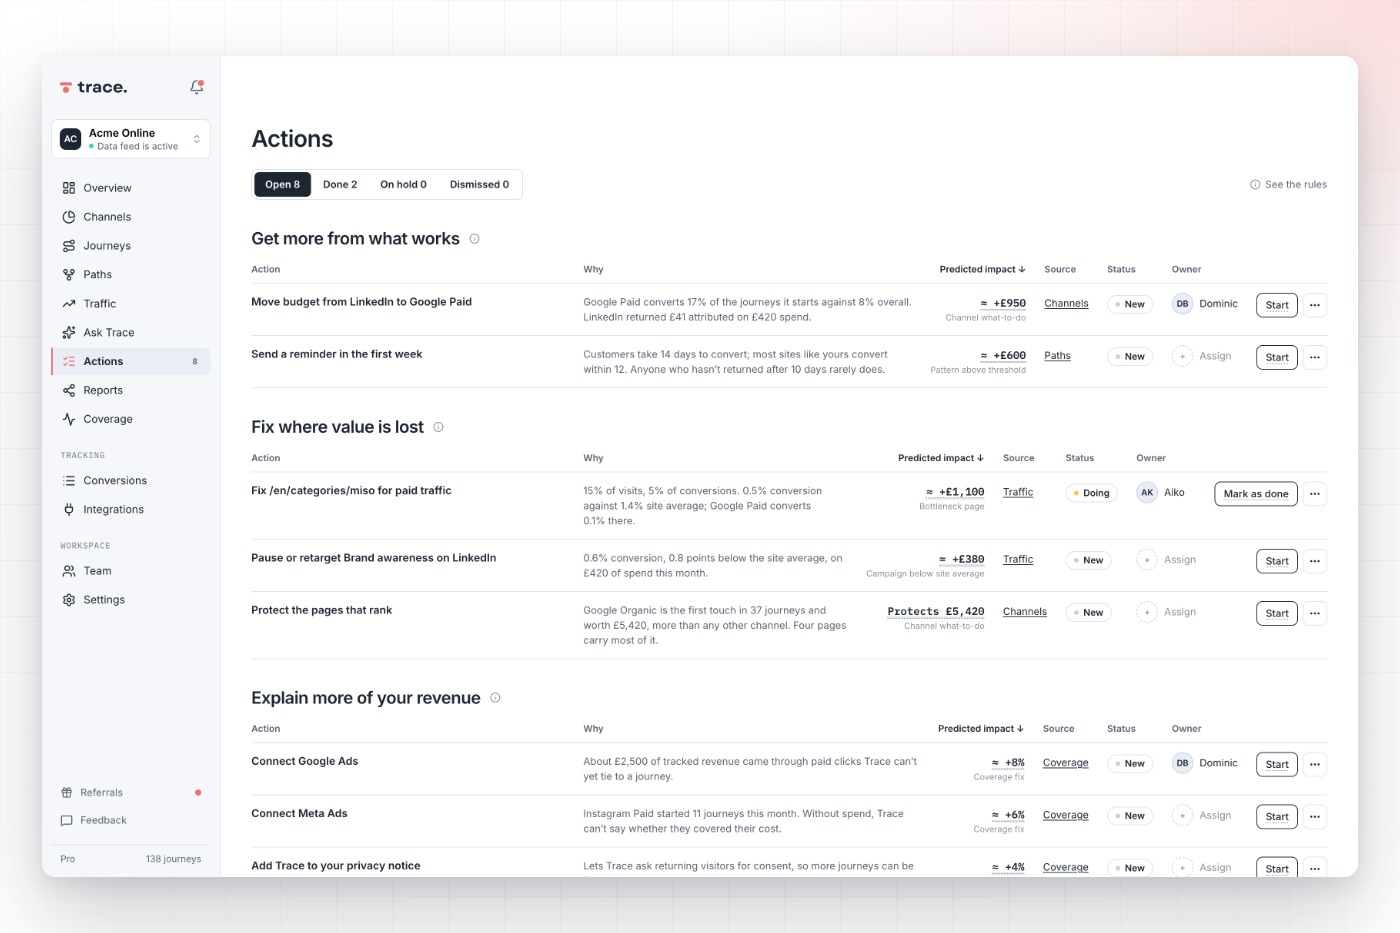
Each insight is a fact with a comparison: what changed, against what, and a link to the journeys behind it. Nothing is listed that you cannot check.
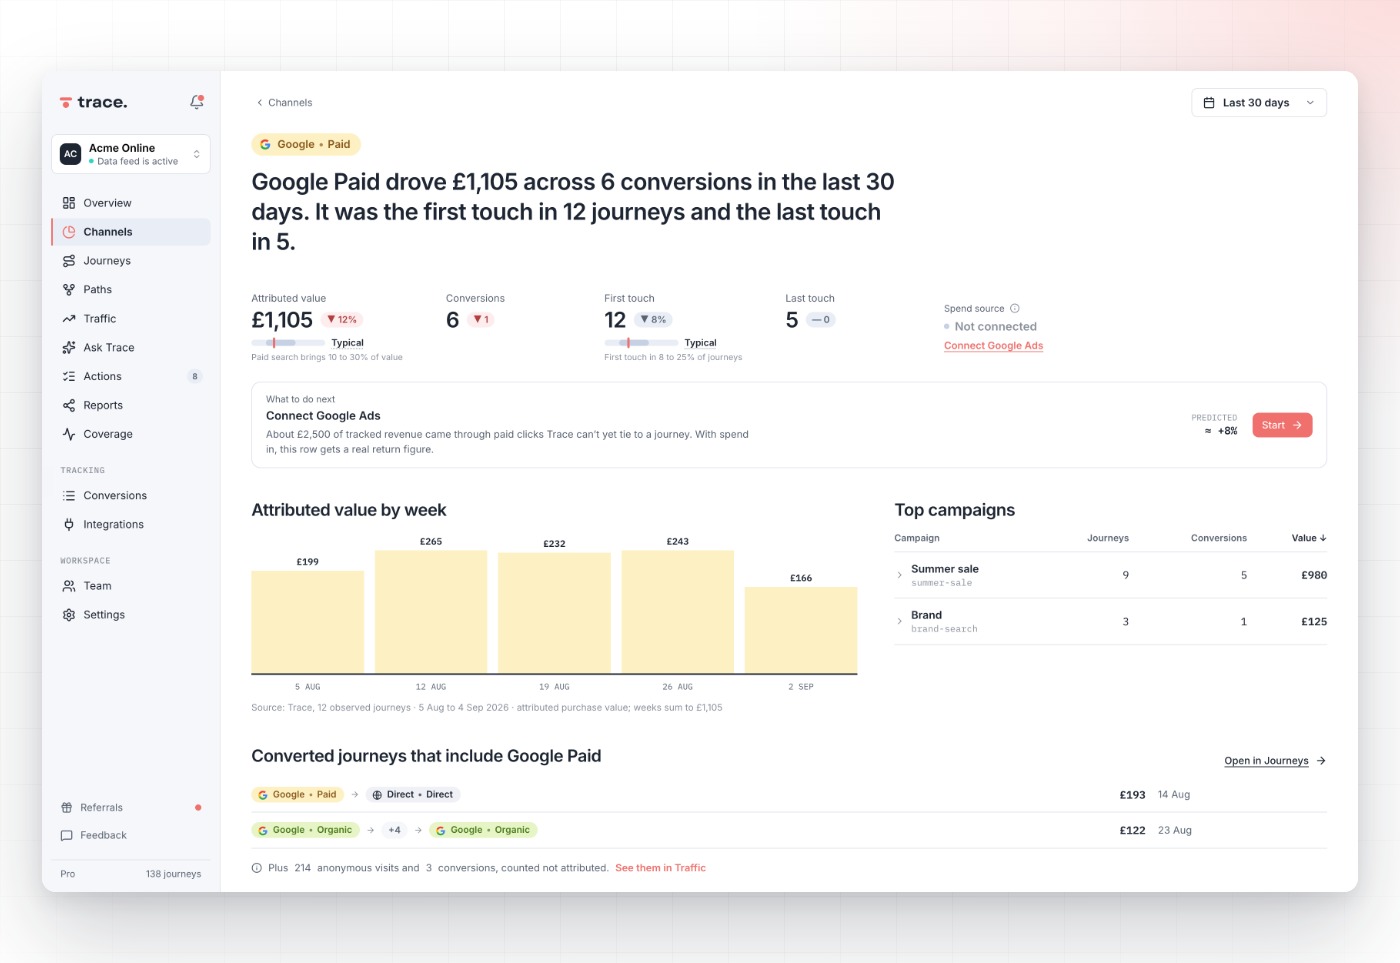
Start here, then go straight to the evidence
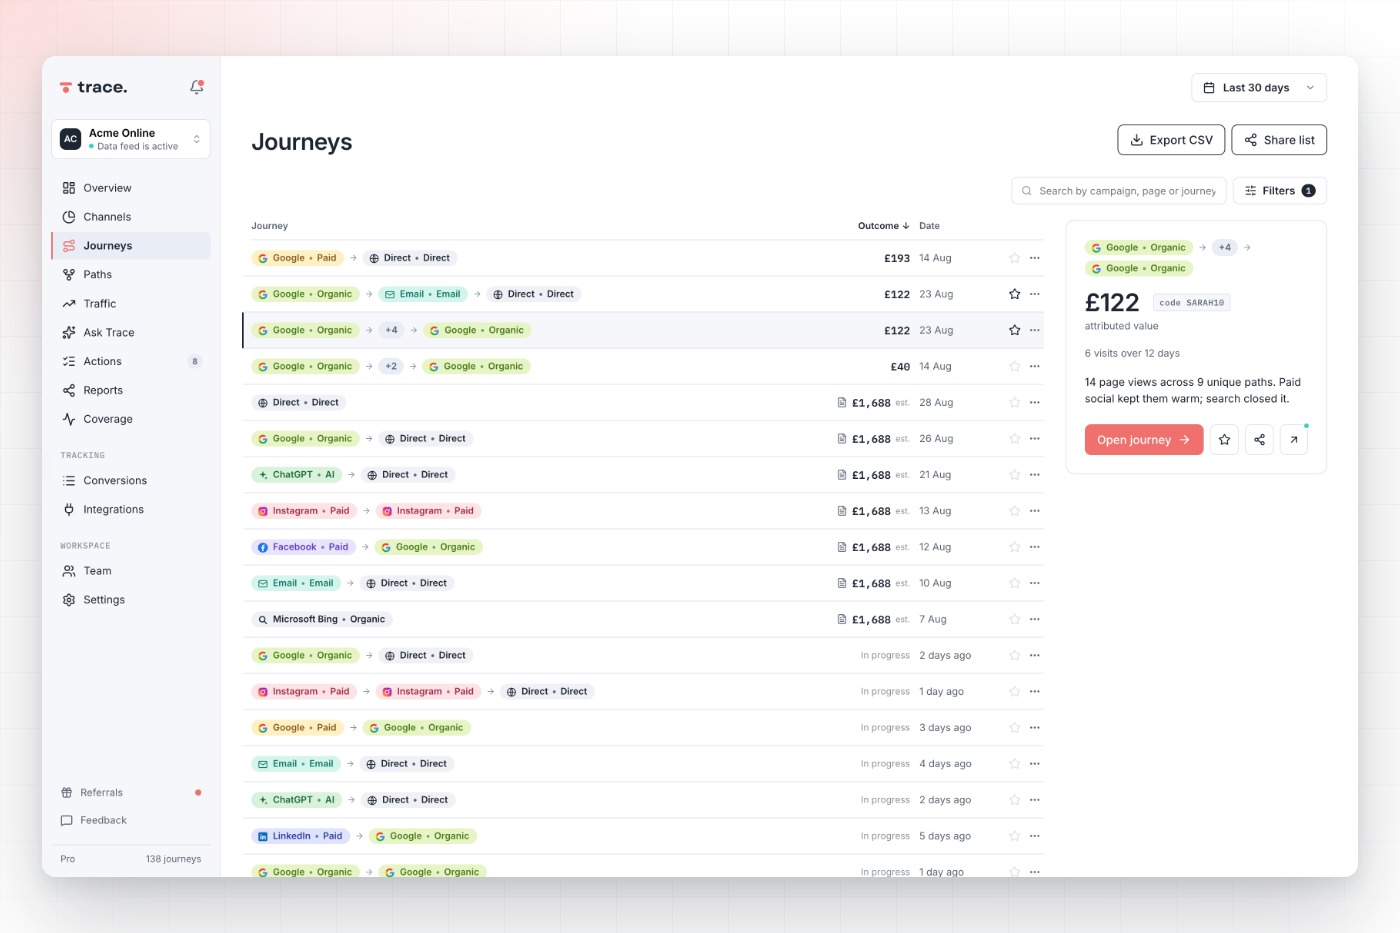
Nothing on Overview is a dead end. Select a channel and you are in Channels, a figure and you are in the journeys that make it up, an insight and you are looking at the visits behind it. The summary is one click from the proof.
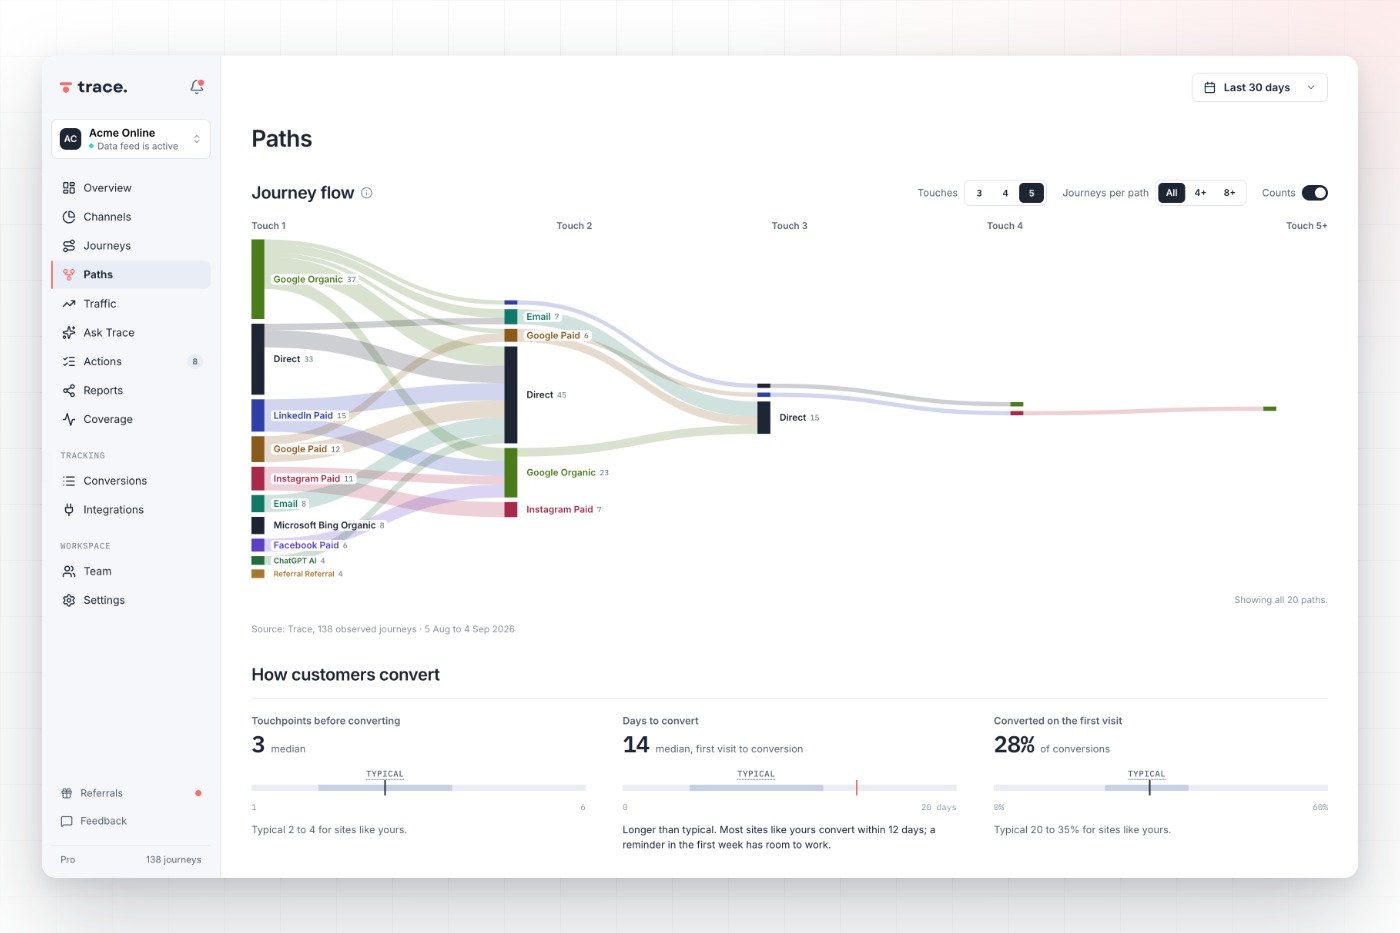
More to discover with Trace
Questions people ask about Overview
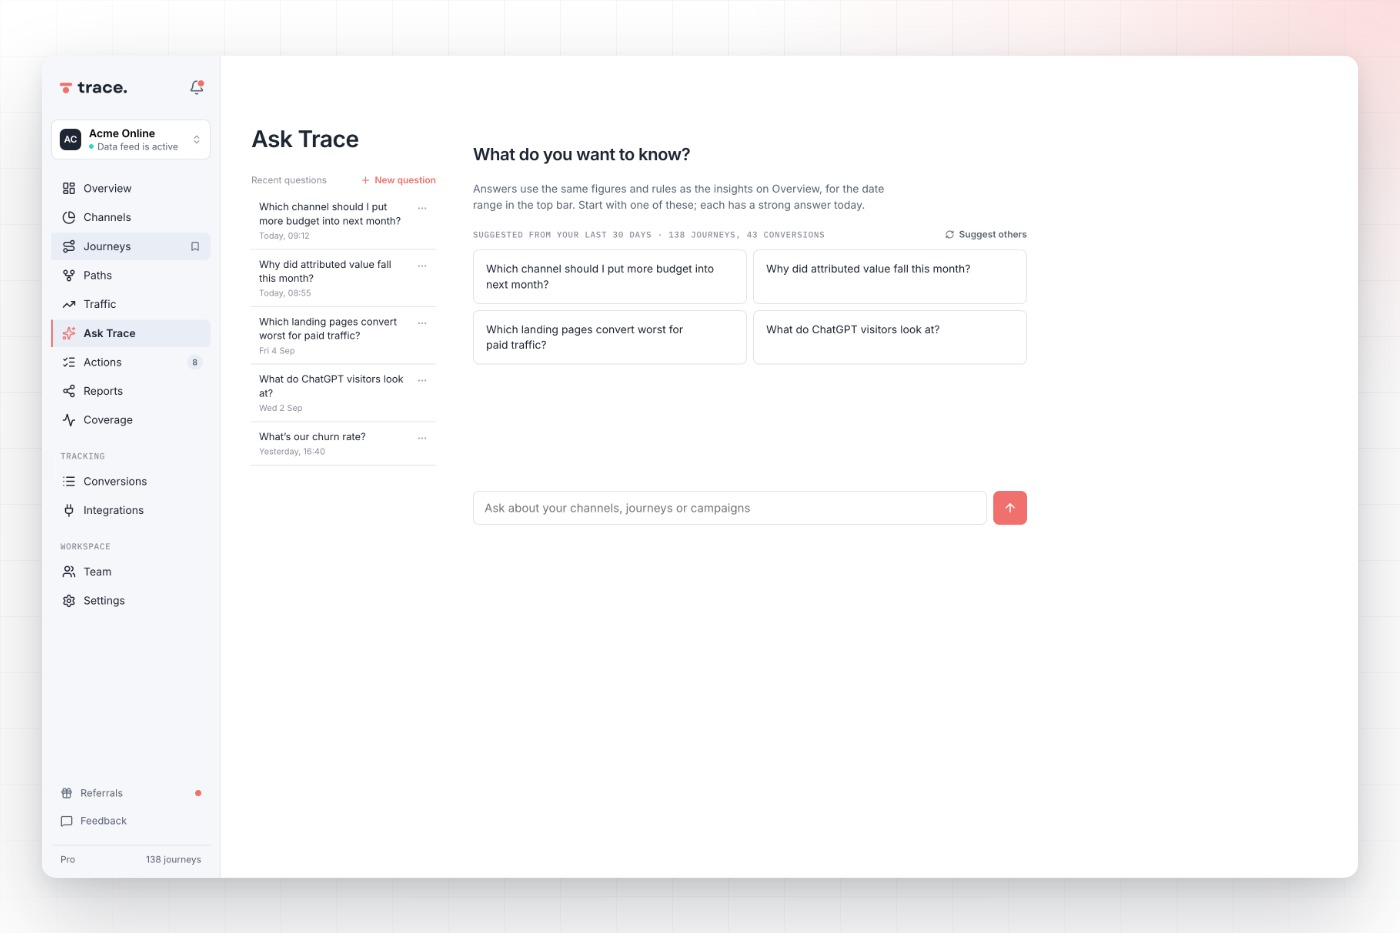
No. It is built from your counted figures using fixed rules, and every claim in it links to the numbers behind it. Ask Trace is separate and optional. See pricing
Yes. Pick the conversions, date range and channels that matter, and the sentence, figures and insights follow. See pricing
Visits and conversions appear within minutes. Attribution is recalculated nightly. See pricing
Still have a question?
Ask us anything about Trace, your setup or your data and a real person will get back to you.
Overview is the marketing attribution dashboard you open first: one plain sentence on the month, the counted figures behind it, and three things worth knowing. Every number links to the journeys that make it up. From here, follow a single journey, or see which channels earned the revenue.