Everything the Trace attribution platform shows you
Every part of Trace starts with the counted figures, tells you what is modelled, and links to the journeys behind it.
See what happened at a glance
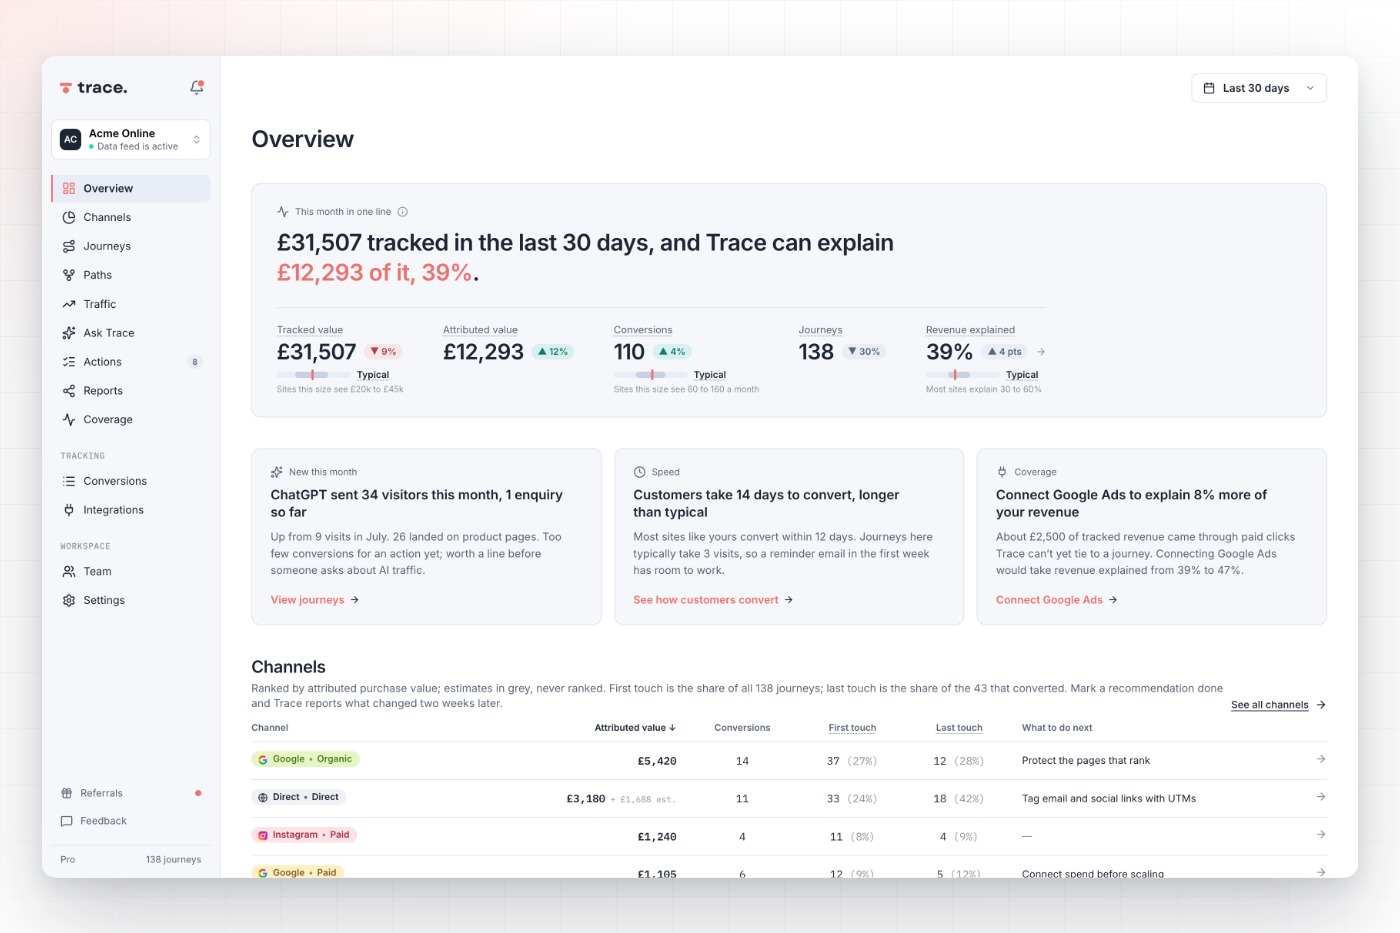
One plain sentence on what happened this month, then the counted figures behind it and three things worth knowing. Every number is one click from the journeys that make it up.
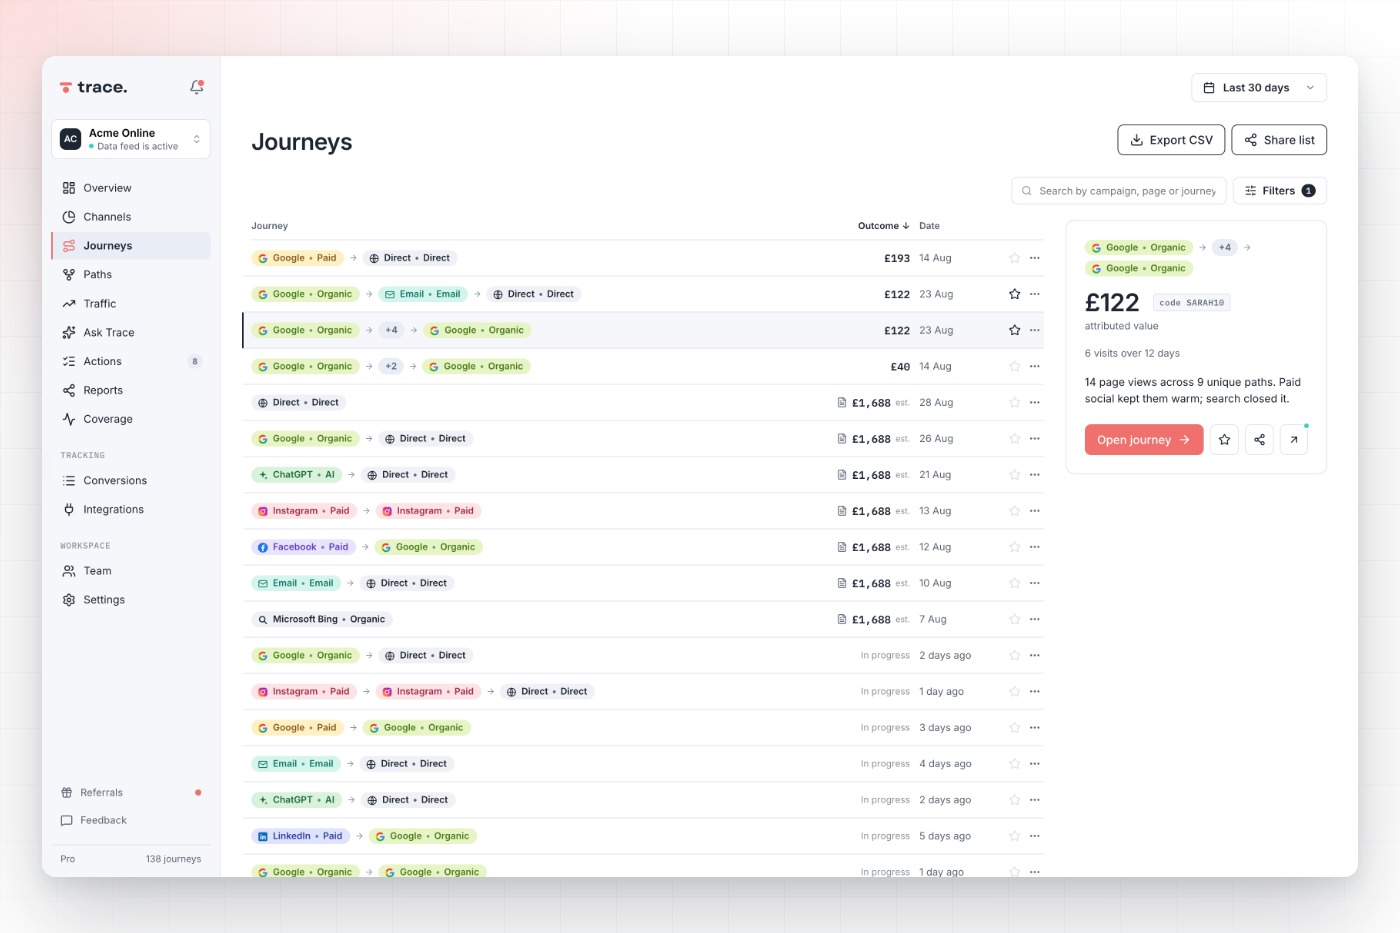
Every visit behind each sale
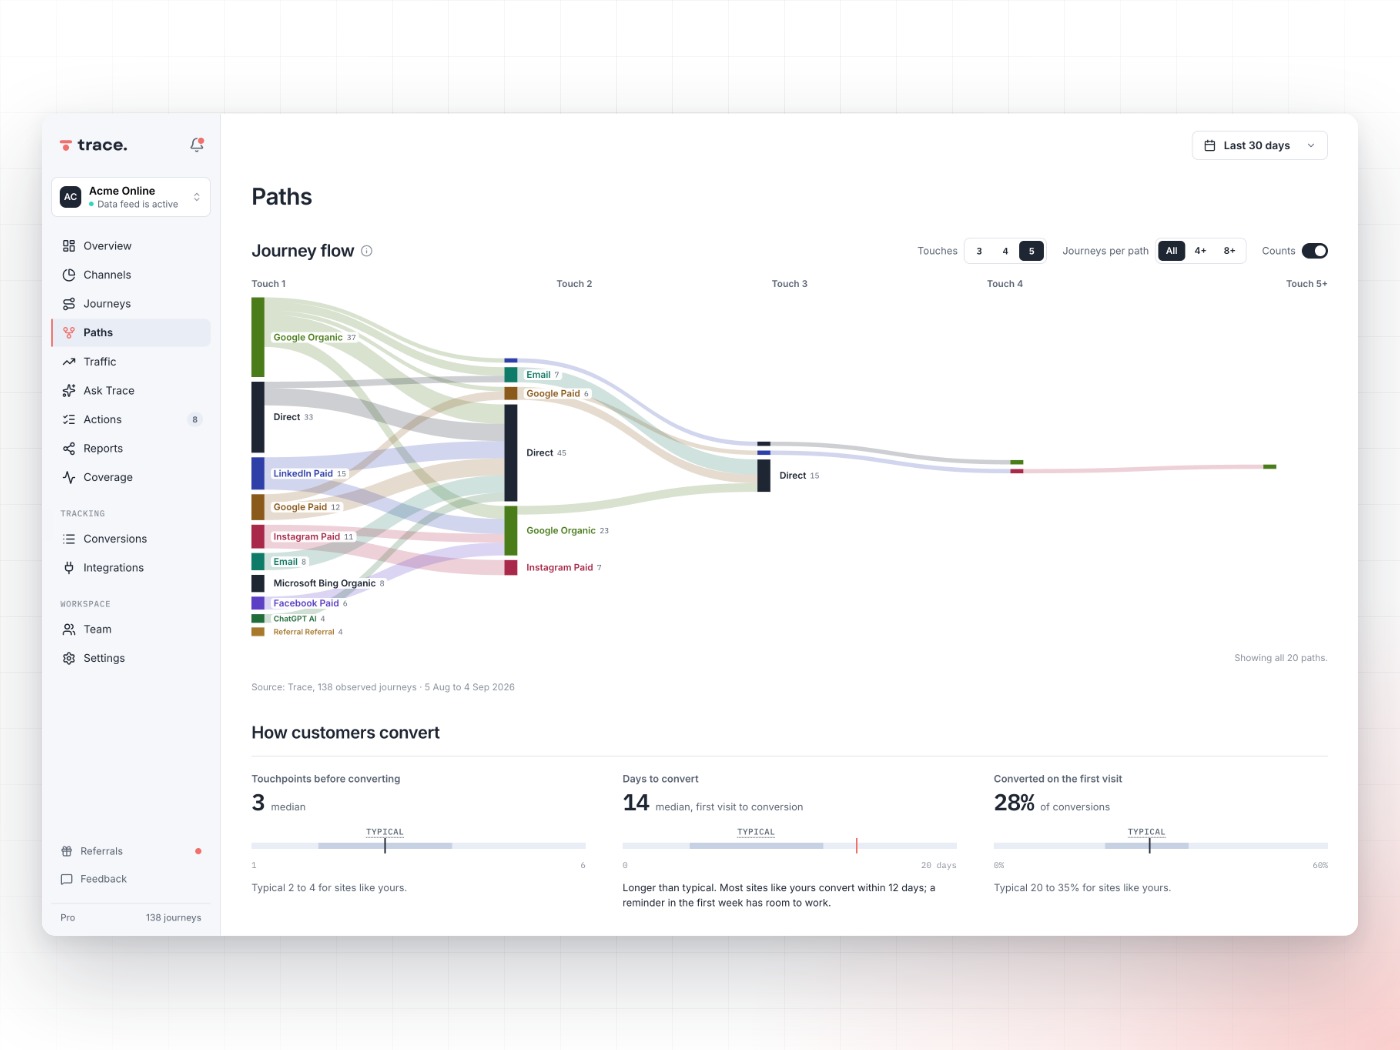
The order people actually visited in, first touch to conversion, with the gaps labelled. Paths groups the journeys that repeat so you can see the routes that keep ending in a sale.
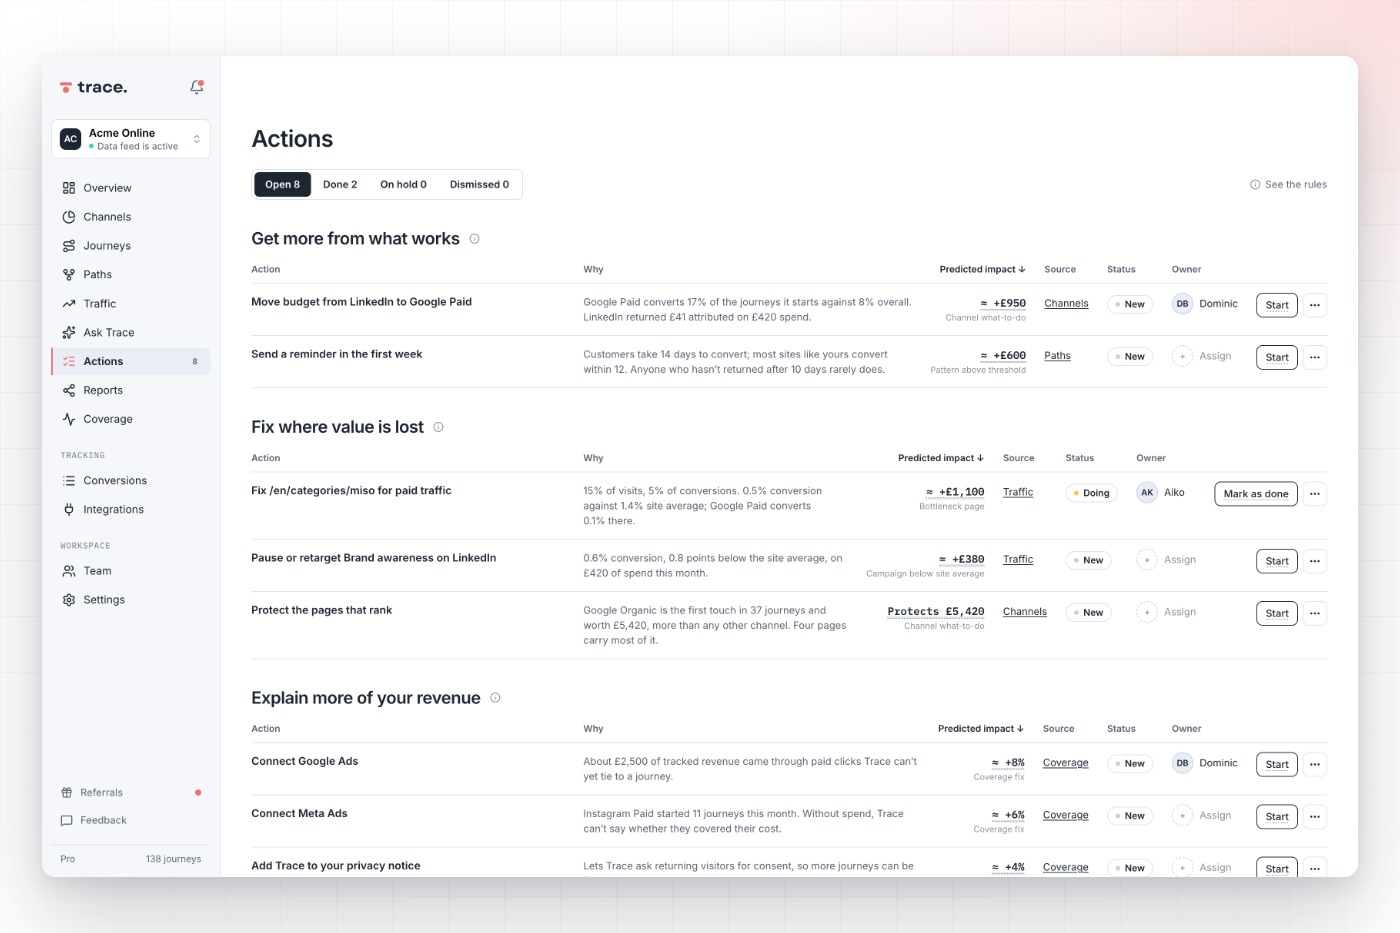
What to do next, with the result tracked beside it
Actions turns the evidence into a short list: move this budget, fix this gap, test this channel. Each carries a predicted outcome, and the actual result is recorded next to it once it lands.
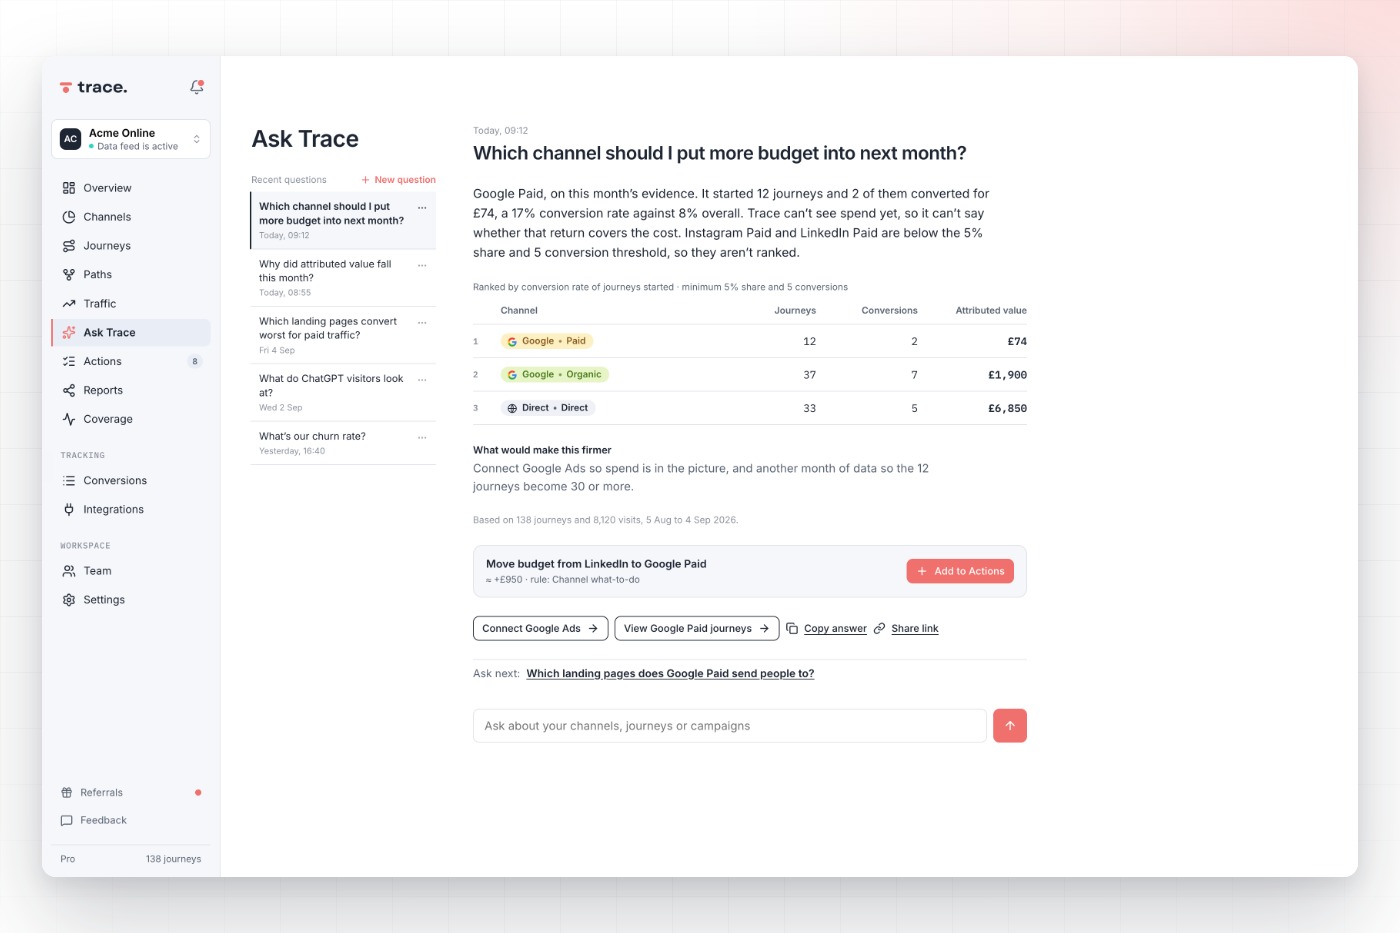
Ask a question, get an answer with its confidence
Ask Trace ranks the touchpoints that most likely influenced a sale, and shows how sure it is. Ask in plain English and get the answer with the journeys it was built from.
Install the snippet and watch the first journeys arrive.
Free forever on one website. No card, no sales call. Your Coverage figure appears as soon as visits do.
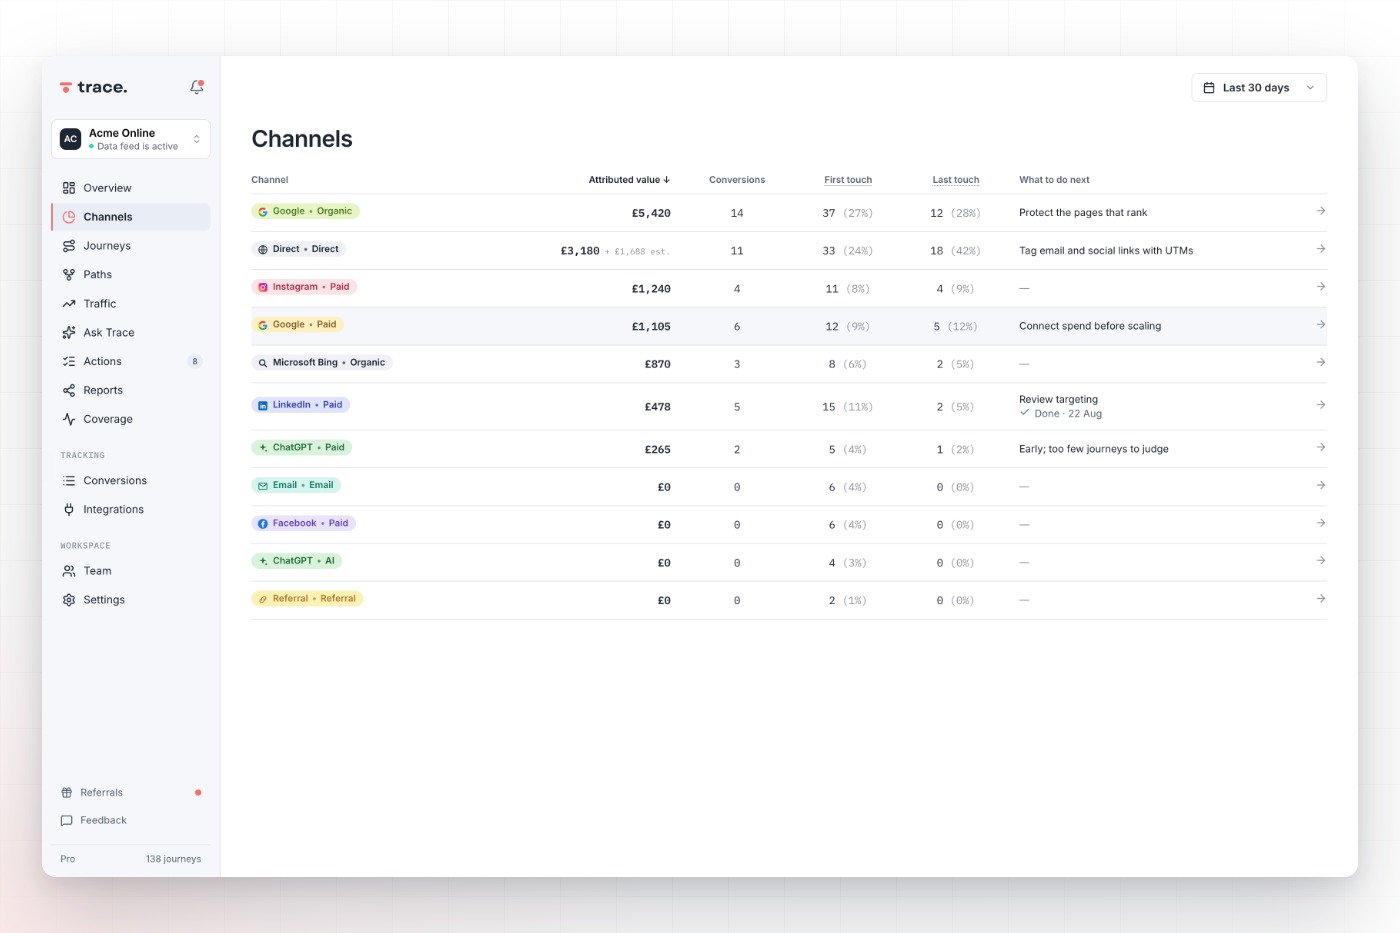
Channels ranked by the revenue they helped bring in
Every channel by attributed revenue, with what the platform claimed for itself beside it. The gap between the two is usually the most useful number on the page.
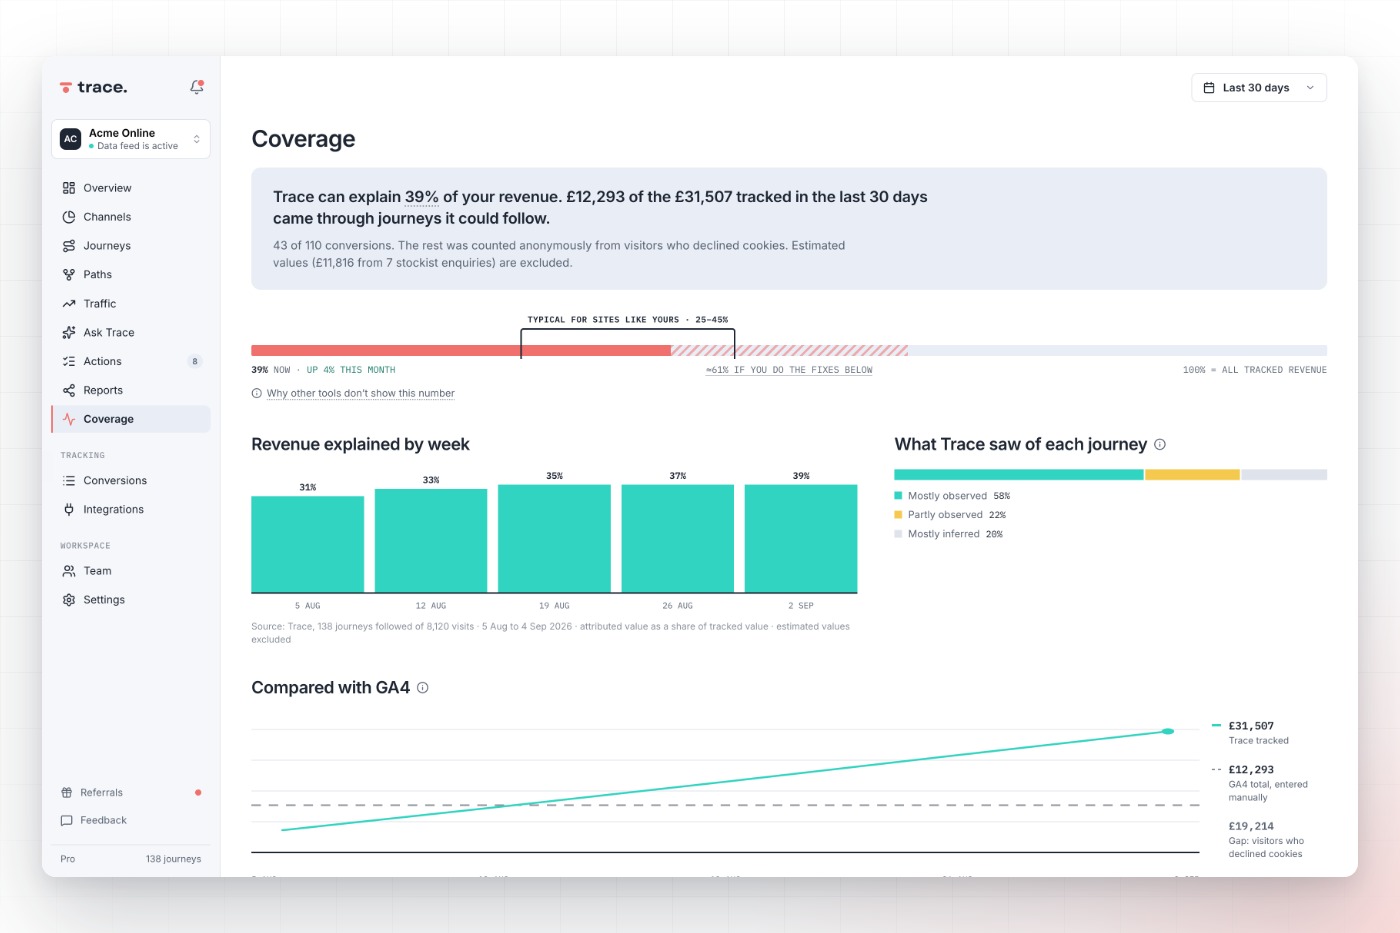
How much of your revenue Trace can explain
Coverage states the share of visits and conversions Trace observed, and what is missing. It sits at the top of every screen so you know which numbers to lean on.
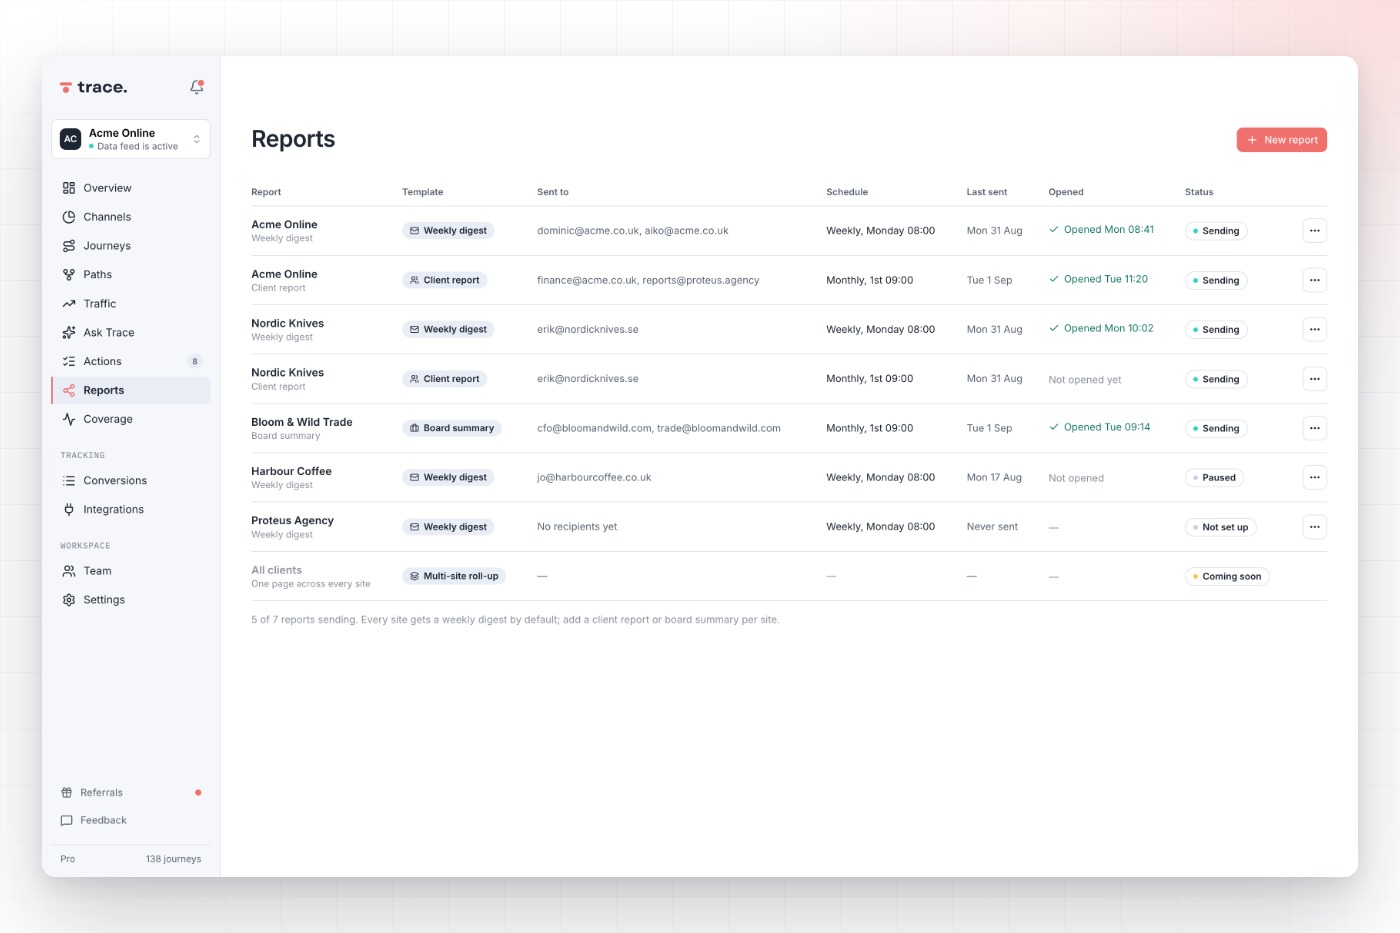
Reports that send themselves
Weekly and monthly reports built from the same counted figures, sent to you and your stakeholders on a schedule. Every chart states its source, date range and coverage.
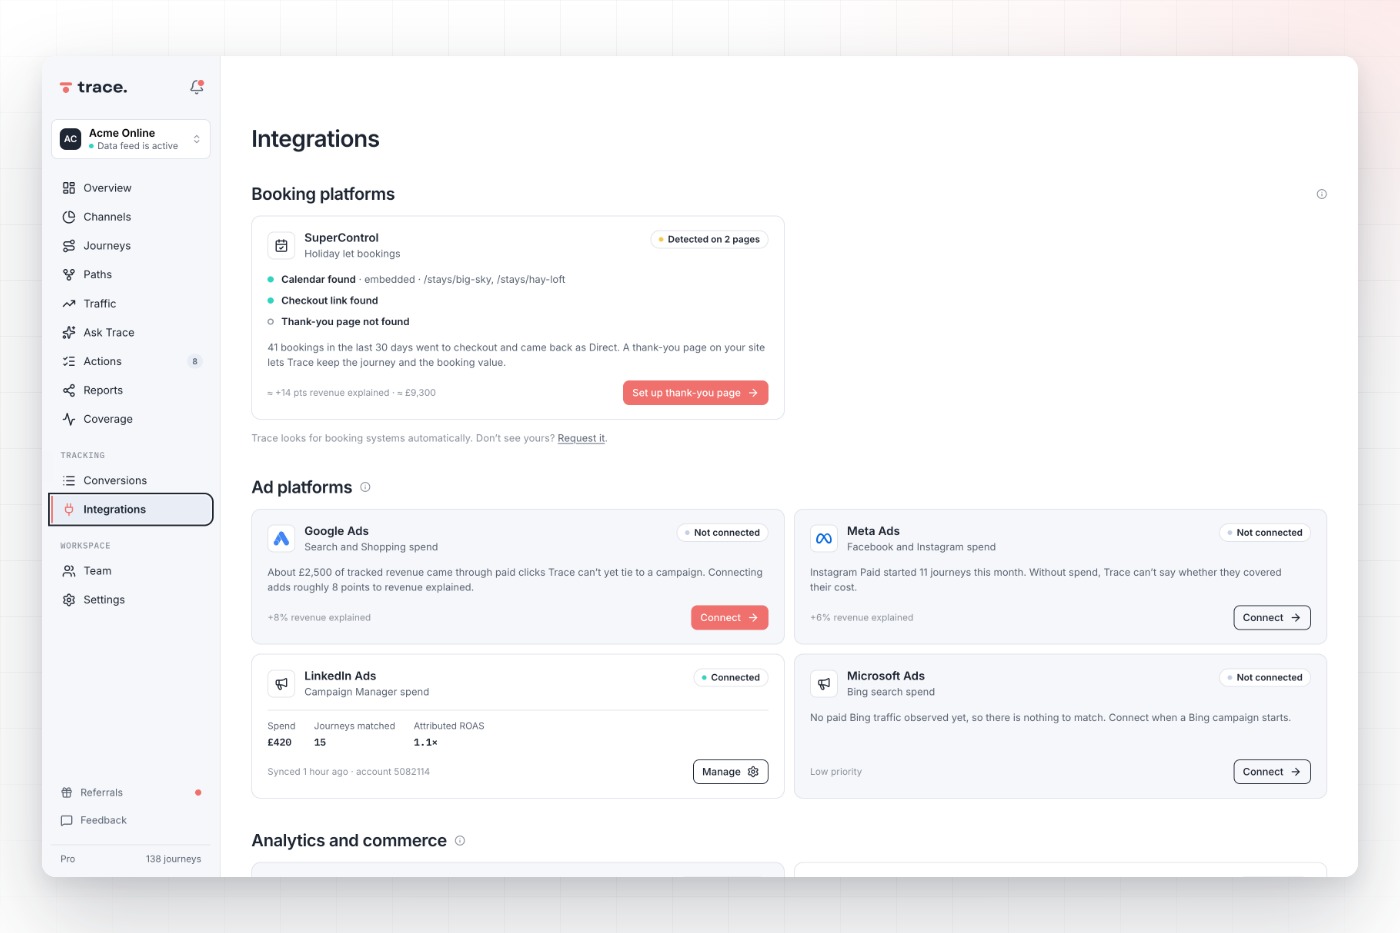
Your store, ad accounts and CRM, connected
One snippet on the site, then connect Shopify, WooCommerce, Google Ads, Meta, HubSpot and more in a click. Trace measures journey patterns, not individuals.
Every part of the Trace attribution platform starts with counted figures and links back to the journeys behind them: Overview, Journeys, Channels, Coverage, Actions, Ask Trace, Reports and Integrations. Start with Overview for a month at a glance, or Coverage to see how much of your revenue Trace can explain.