
Prove marketing ROI, then put more into what works
Every platform counts the same sale as its own. Trace follows the journey behind each sale and lead, so you can prove marketing ROI with evidence and show the board why the budget moved.
Your marketing is judged by scorecards the platforms write themselves.
Eighteen conversions claimed, nine made
Google and Meta each count the same sale as theirs. Add their dashboards together and you have more sales than your bank account does.
Ten sales, six weeks, four channels
A search, an email, an Instagram ad and a direct visit, in that order. Last click gives the credit to the last one and nothing to the first.
The whole journey, and how much of it is proven
Every visit behind each sale and lead, the channels that appeared in the journeys that converted, and the share of revenue Trace can explain.
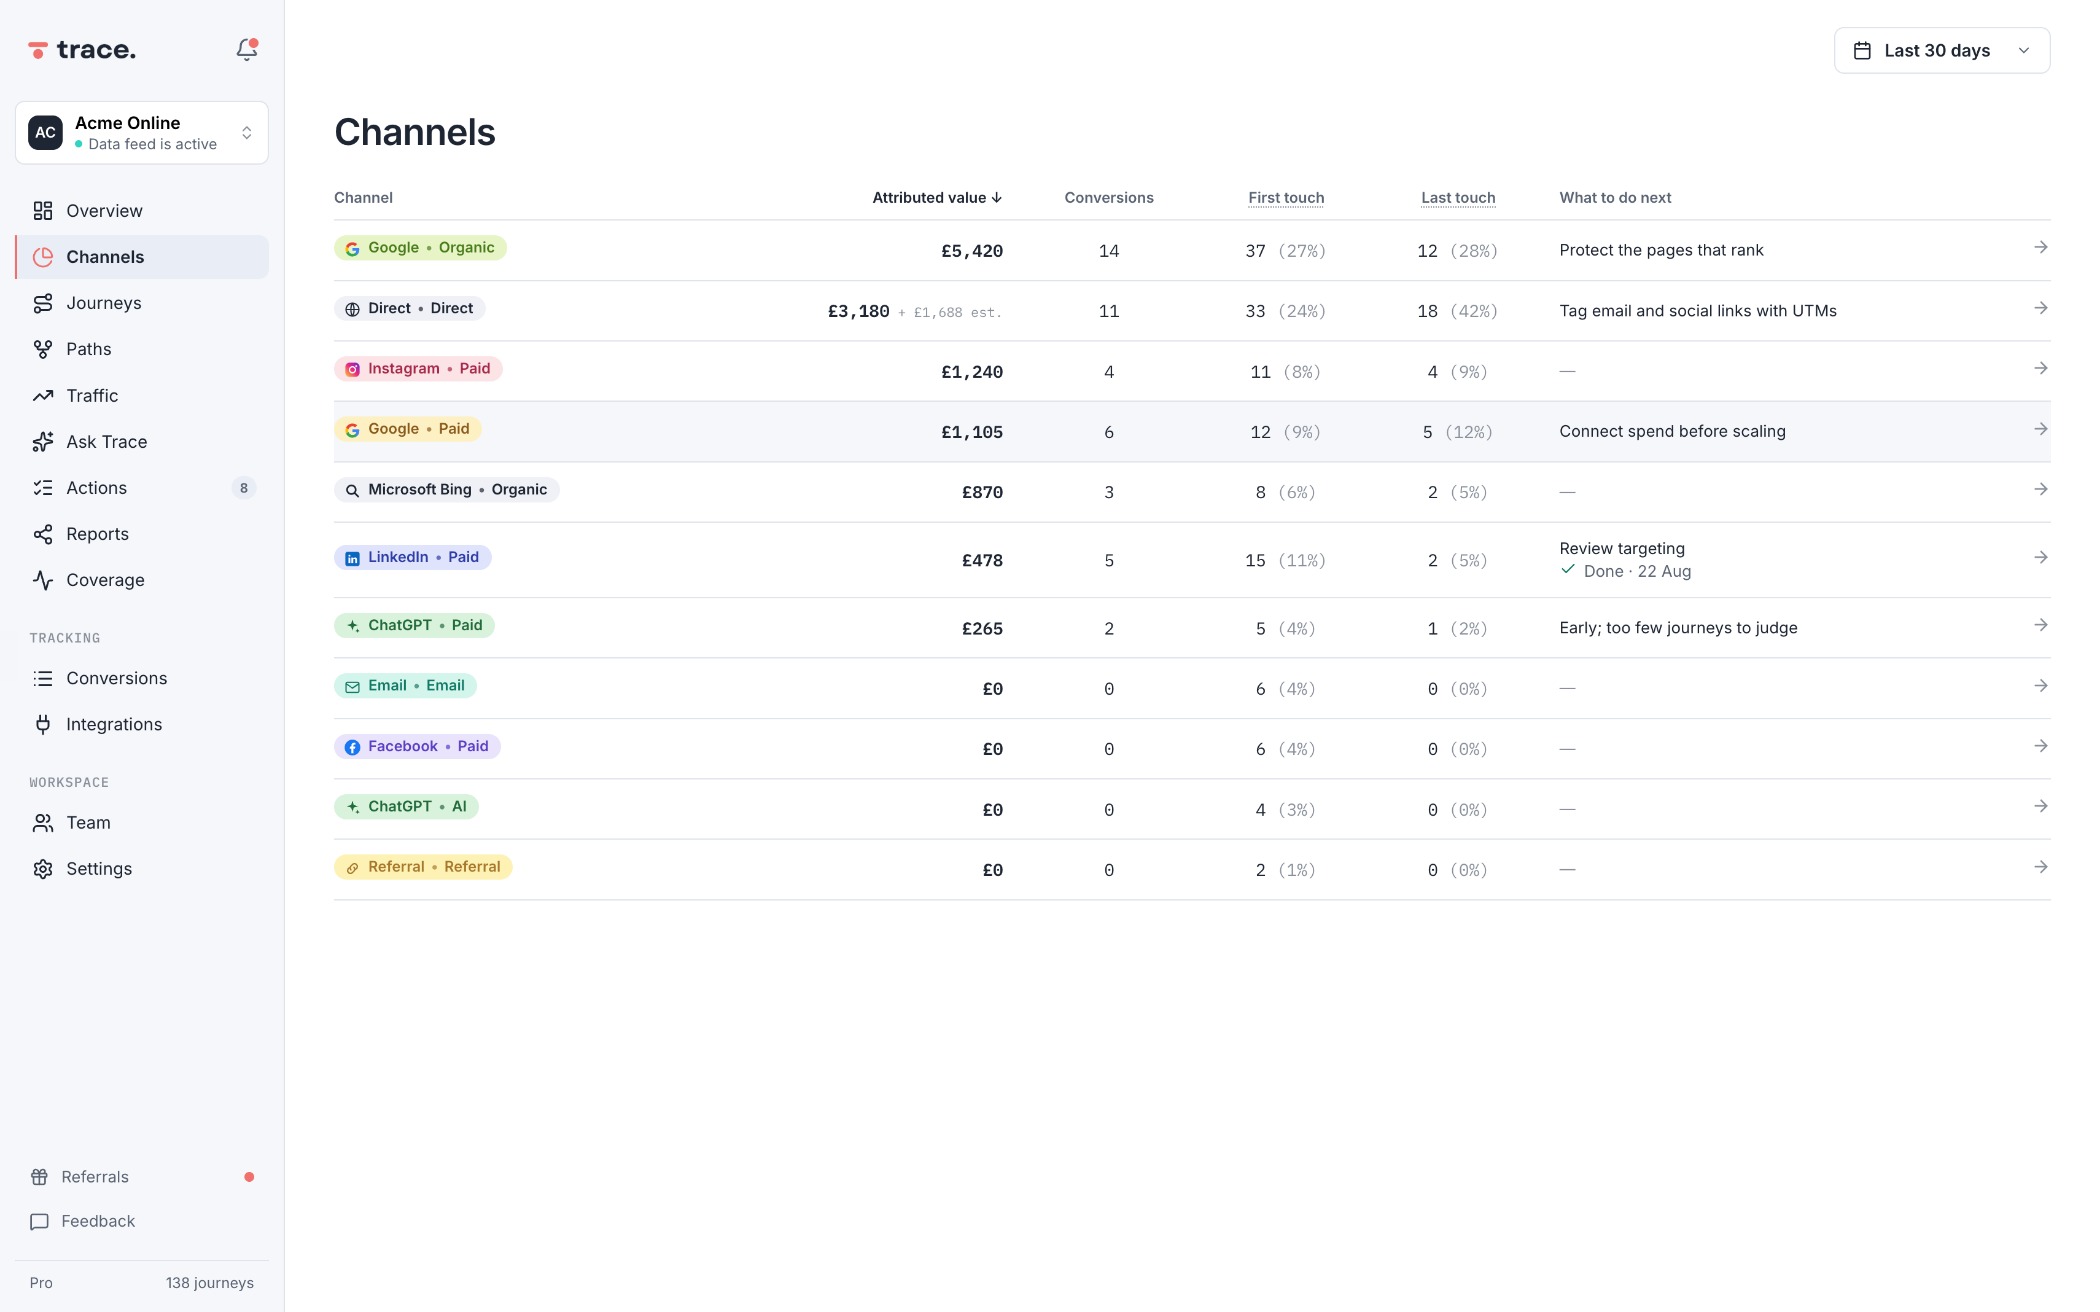
See which channels bring customers in
Channels ranked by the revenue in the journeys they were part of, not by what each platform claimed. Spend sits beside attributed revenue, so the conversation moves from clicks to revenue.
See Channels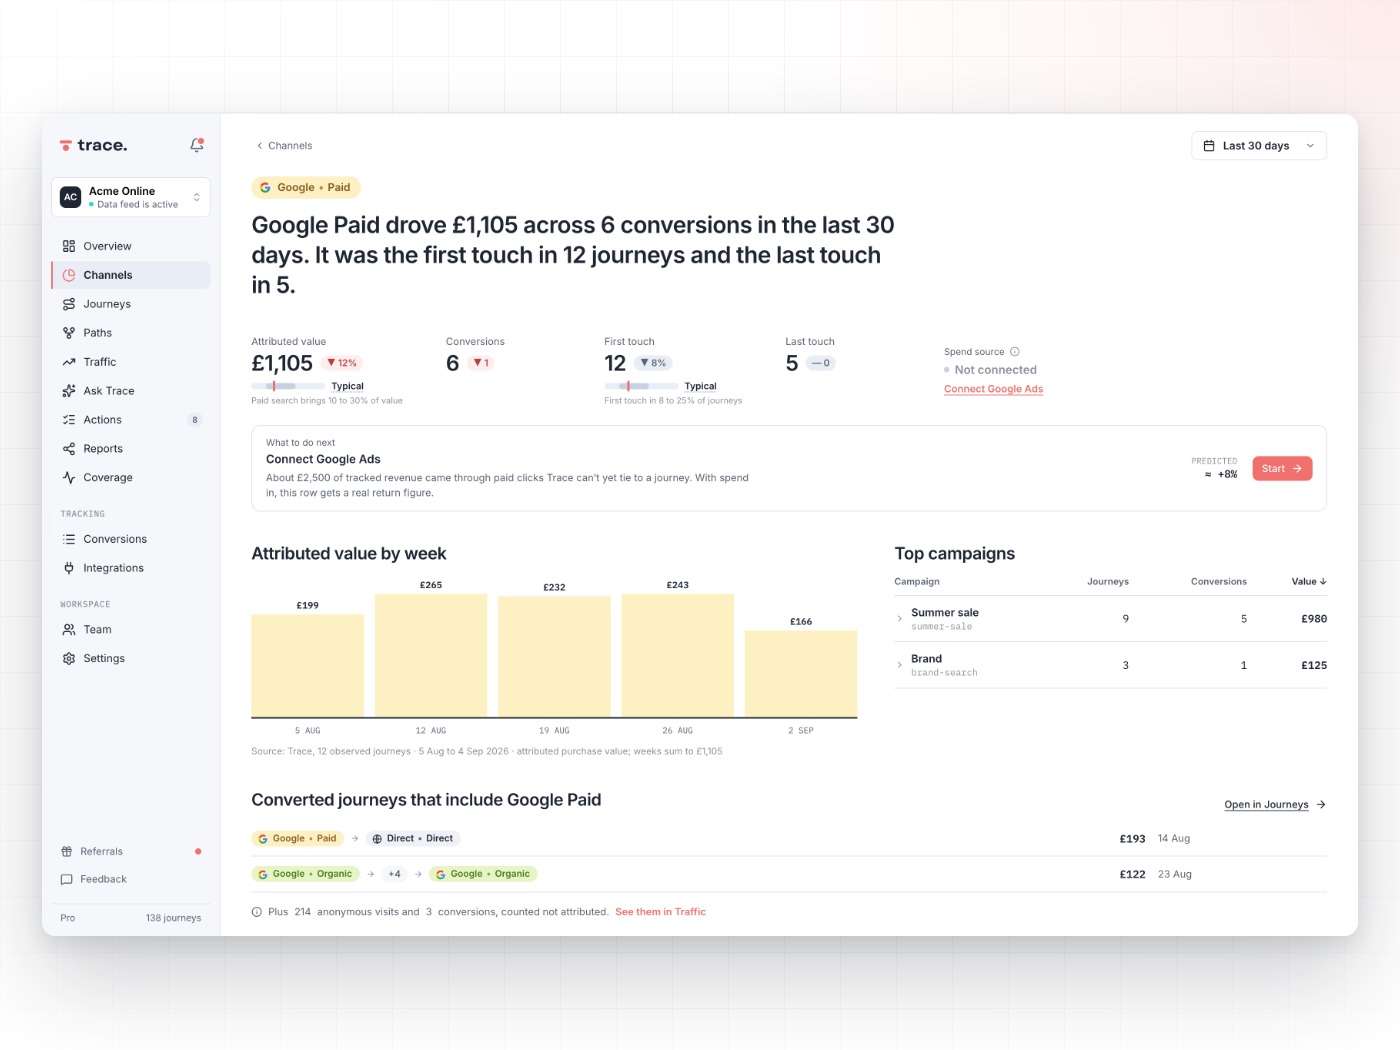
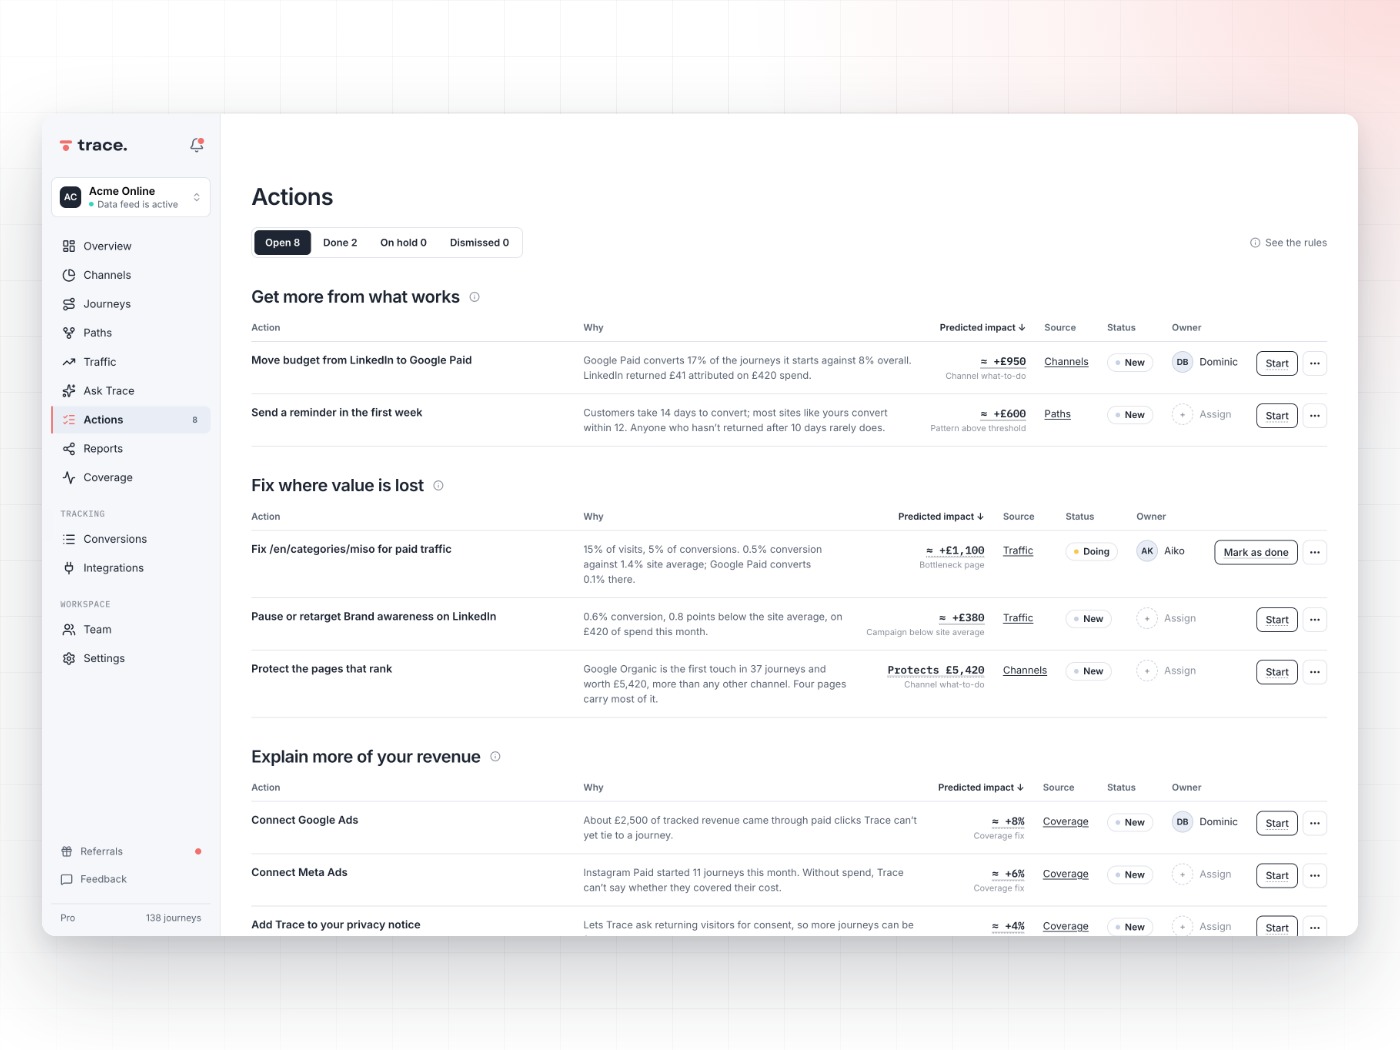
Know what to do next, and see if it worked
Trace finds the actions most likely to bring in more revenue, each with a predicted outcome. Act on one and the actual result appears beside the prediction, so next quarter’s budget case writes itself.
See ActionsThe report that shows which spend made money
A scheduled report with the journeys behind each sale, the channels that were in them and the coverage figure stated. Every month you see which spend earned its place, and where the next slice of budget should go.
See Reports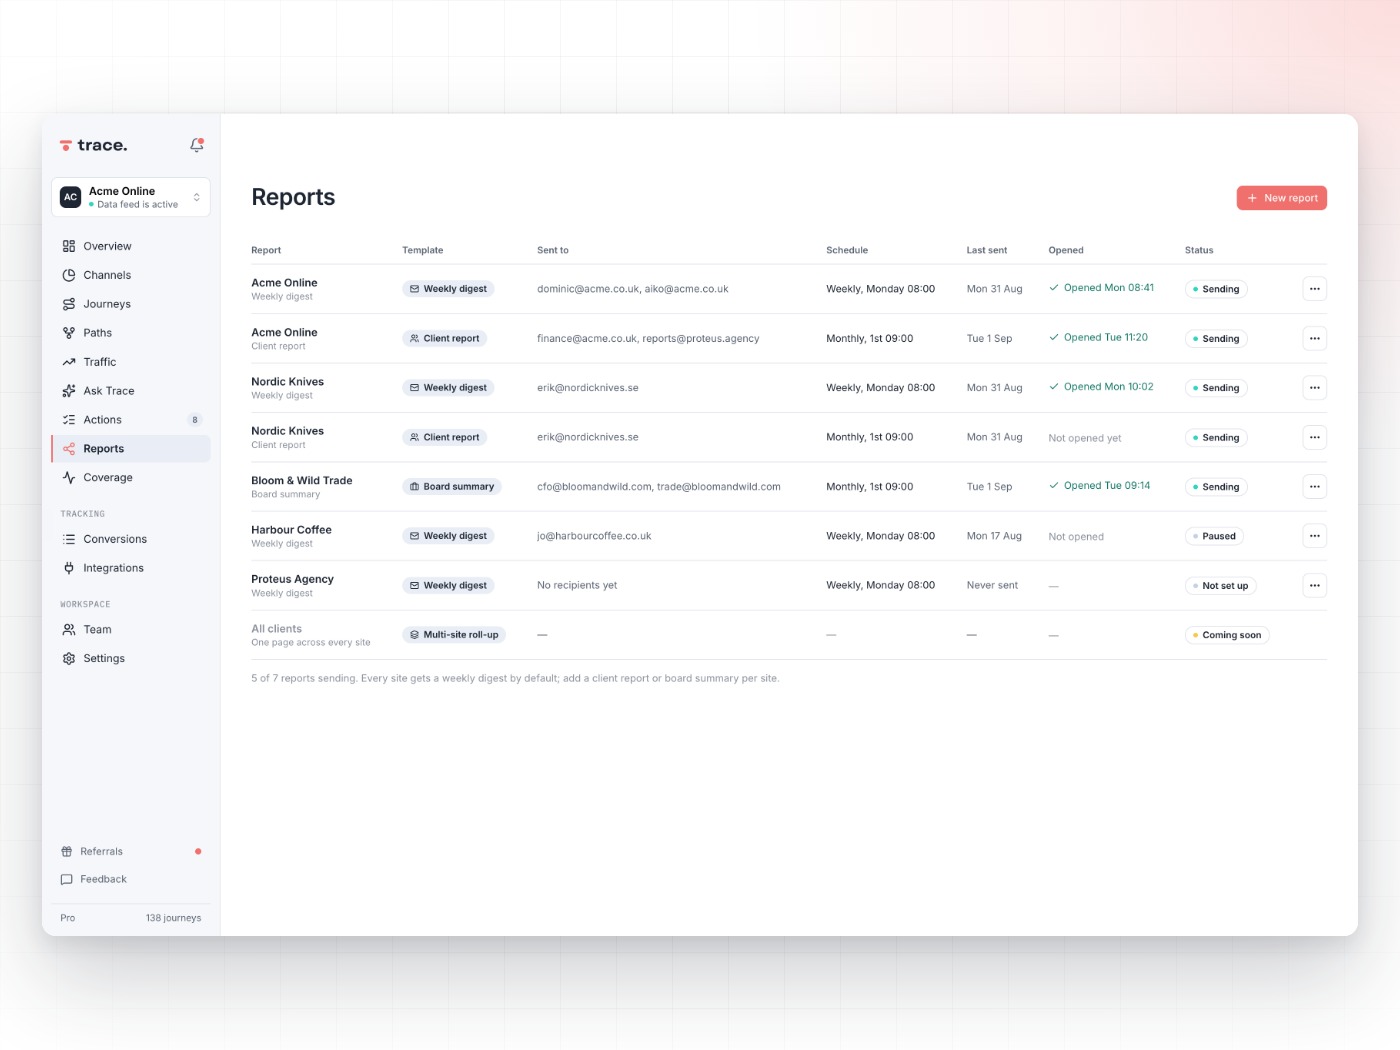
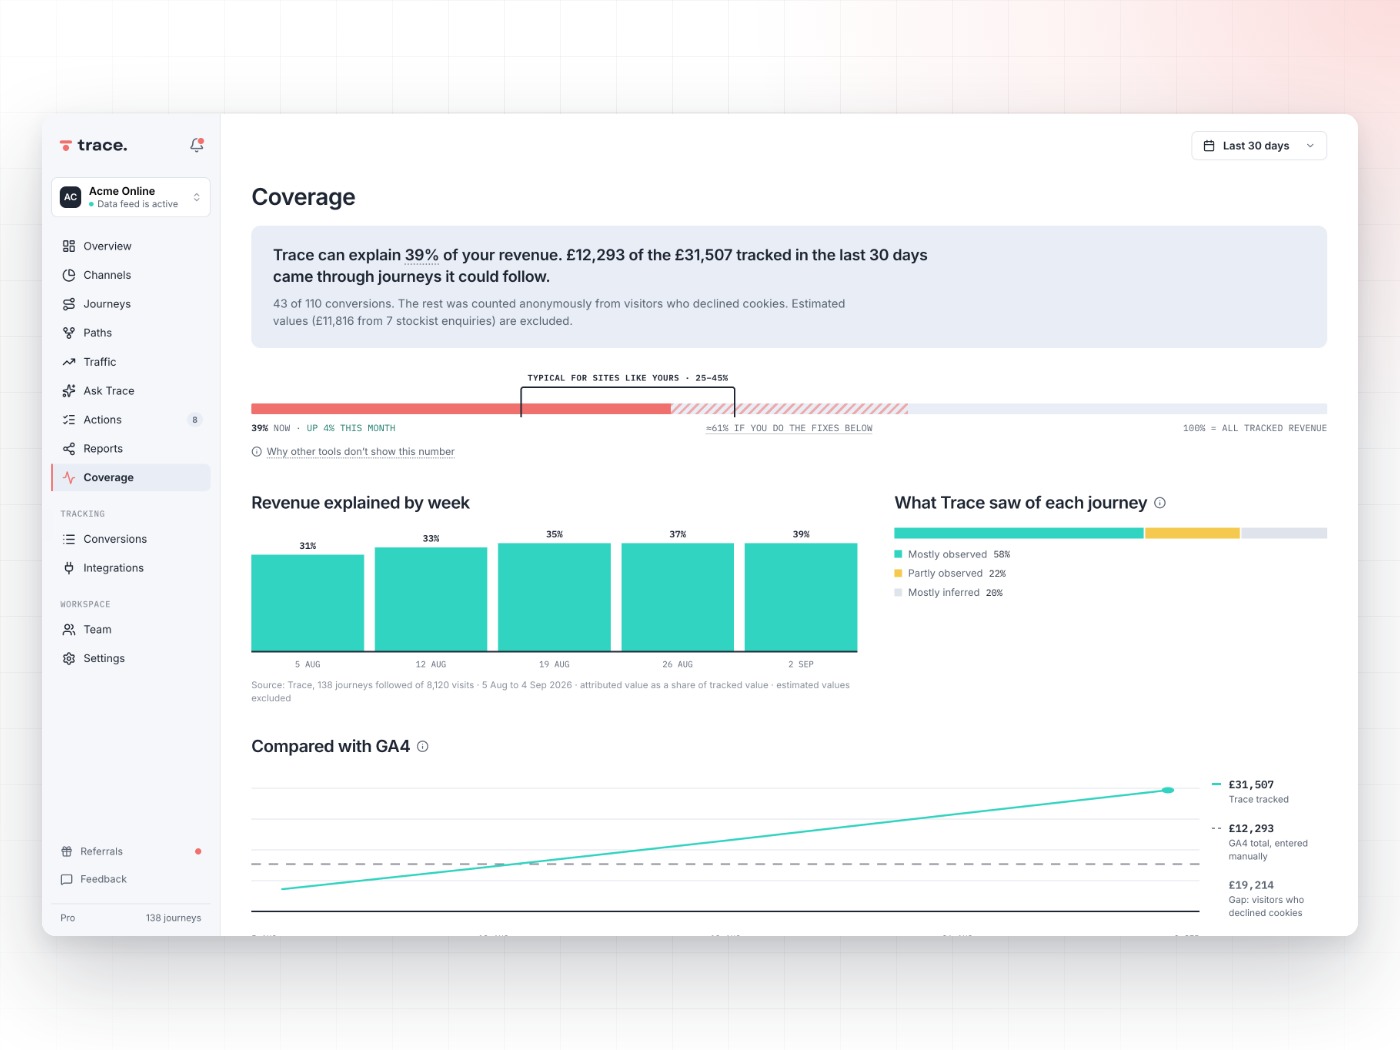
How much of your revenue can you explain?
Coverage is the share of revenue Trace can explain with tracked evidence. Real purchases and lead values only. We show you where the evidence stops.
Start free. Pay when it pays for itself.
- Overview, Channels and Journeys
- Google Ads, Meta Ads, HubSpot, Shopify and WooCommerce integrations
- Ask Trace: 3 set questions
- Example Actions, marked as examples
- Unlimited team seats
- 90 days of marketing data retention
- Everything in Starter
- Ranked recommendations with outcomes
- 250 Ask Trace credits a month
- Reports, built and scheduled
- Benchmarks against similar sites
- All ad platform, CRM and commerce integrations
- 1 year of marketing data retention
- Everything in Plus
- 1,000 Ask Trace credits a month
- Single sign on
- Priority email support, 1 business day
- Unlimited team seats
- 2 years of marketing data retention
Questions in-house teams ask
Typically less than 5 minutes. One code snippet added to your site, or use the Shopify app or WordPress plugin. Most teams see their first journeys within the hour.
No. Connect Google Ads, Meta Ads and your CRM and Trace puts spend beside the revenue in the journeys each channel appeared in.
No tracking is one hundred percent. We track your coverage, which tells you how much of your revenue Trace can explain. We show you where the evidence stops.
Trace is built for the Data Protection Act, UK GDPR, the DUAA and CCPA. Trace measures journey patterns, not individuals.
Nothing changes on your bill. Plans are priced per website, not per visit, ad spend or per journey.
Not sure where to start?
Run the free audit and we will tell you your Coverage before you sign up for anything.
In-house teams use Trace to prove marketing ROI from evidence rather than platform claims. The journey behind each sale and lead, the channels that earned them, and how much of the revenue Trace can explain. See which channels bring customers in, or what to do next.